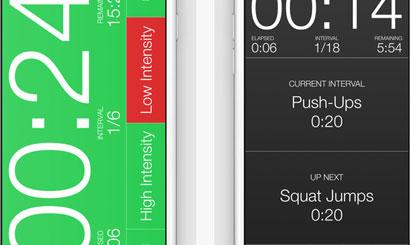
7 iPhone / iPad Apps for Data Visualization
0Becoming a data scientist can be lots of fun if you care about making sense of complex data. Even if you are not a pro, you could still use data visualization tools to better understand complex sets of data. There are plenty of sophisticated analytics packages available on the market these days. Here are 7 apps you can use to visualize data on your phone or tablet:
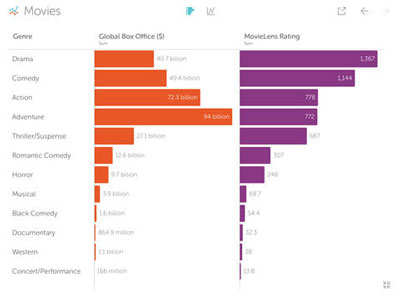
Vizable: turns your data into interactive visuals. It lets you pan and zoom through data in CSV and Excel files.
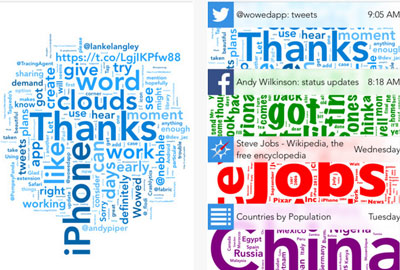
Wowed: creates word clouds from Twitter, Facebook, and websites. You can customize and share your word clouds easily.
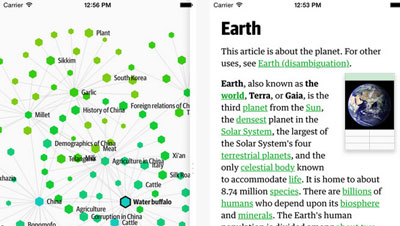
Wikiweb: a Wikipedia reader that visualizes connections between articles. It helps you discover new interesting articles every time.
StockTouch: has a beautiful visual interface that helps you keep up with stock data on your iPad. It helps you identify trends related to companies and sectors.
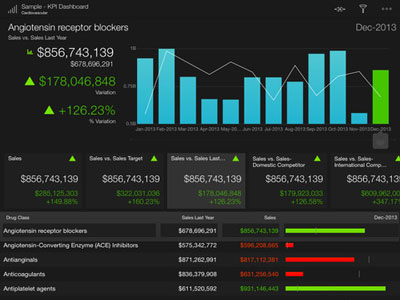
Roambi Analytics: helps you create interactive reports, charts, and data visualizations. It supports data from Excel, Google spreadsheets, and analytics.
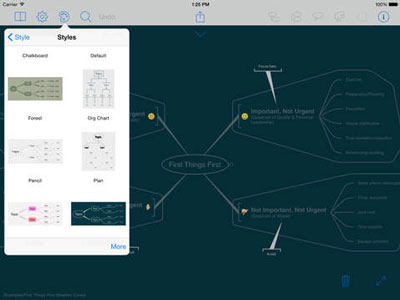
iThoughts: a powerful mind-mapping tool for the iPad and iPhone. It is useful for brainstorming, project planning, and task management.
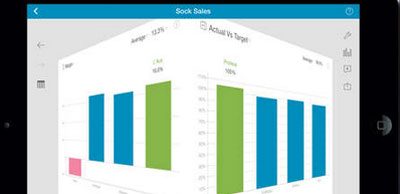
Chartcube: lets you create a data presentation from a spreadsheet. Lets you interact with charts and collaborate with others.
What are your favorite data visualization tools for iOS?


